
September 2026
Introducing Real-SWE
Benchmarking frontier AI models on private, real-world, enterprise codebases.

01
Introduction
Today we are releasing Real-SWE, a benchmark that evaluates frontier AI models on private, real-world, enterprise codebases. Each task comes from a private production codebase that we licensed from a real-world company.
- Private codebases. Agents must navigate proprietary systems whose code and solutions are not available on the public internet.
- Work with business consequences. Getting billing right, calculating taxes, and migrating customers can affect how a business runs.
- Company-specific complexity. Every company has its own rules and ways of writing code.
Can a coding agent actually do the work of a software engineer in the real world?
| # | Model | Harness | |
|---|---|---|---|
| 1 | Fable 5.1 | Claude Code | 38.8% |
| 2 | GPT-6 Astra | Codex CLI | 33.8% |
| 3 | Gemini 3.8 Flash | Gemini CLI | 31.2% |
| 4 | GLM 5.3 | Claude Code | 28.8% |
| =5 | Grok 4.6 | Grok Build | 23.8% |
| =5 | Muse Spark 1.3 | Muse Code | 23.8% |
| 7 | Kimi K3 | Kimi Code | 18.8% |
| 8 | GPT-5.6 Sol | Codex CLI | 16.2% |
Resolution rate is equivalent to pass@1, averaged over eight independent runs per task. 95% confidence intervals are shown.
Correct billing depends on business rules and external services
Fix invoice billing so each business charges the right tax and exempt customers are not taxed.
View full instruction
Local specimen of the observed disclosure. In a production recipe, give the full task instruction in this expanded region.
Agents work across code, infrastructure, and business tools
Tools and services across Real-SWE task environments. Each task exposes only the services its workflow needs.
02
Analysis
6 of 10 tasks have resolution rates below 15%
| Task | Fable 5.1 | GPT-6 Astra | Gemini 3.8 Flash | GLM 5.3 | Grok 4.6 | Muse Spark 1.3 | Kimi K3 | GPT-5.6 Sol | Resolution rate |
|---|---|---|---|---|---|---|---|---|---|
| Multi-region sweep | 7/8 | 8/8 | 8/8 | 2/8 | 3/8 | 8/8 | 2/8 | 5/8 | 67.2% |
| API keys & environments | 8/8 | 5/8 | 7/8 | 5/8 | 4/8 | 6/8 | 0/8 | 7/8 | 65.6% |
| Entitlement overage lines | 8/8 | 7/8 | 5/8 | 3/8 | 1/8 | 1/8 | 6/8 | 1/8 | 50.0% |
| Customer identity migration | 3/8 | 1/8 | 3/8 | 4/8 | 8/8 | 3/8 | 4/8 | 0/8 | 40.6% |
| Billing schedule migration | 3/8 | 1/8 | 2/8 | 2/8 | 0/8 | 0/8 | 1/8 | 0/8 | 14.1% |
| API token metering | 1/8 | 5/8 | 0/8 | 1/8 | 0/8 | 0/8 | 1/8 | 0/8 | 12.5% |
| S3 datastore measurement | 0/8 | 0/8 | 0/8 | 3/8 | 2/8 | 1/8 | 1/8 | 0/8 | 10.9% |
| Linearizable scan | 0/8 | 0/8 | 0/8 | 2/8 | 1/8 | 0/8 | 0/8 | 0/8 | 4.7% |
| Tax jurisdiction | 1/8 | 0/8 | 0/8 | 1/8 | 0/8 | 0/8 | 0/8 | 0/8 | 3.1% |
| Analytics stream reducer | 0/8 | 0/8 | 0/8 | 0/8 | 0/8 | 0/8 | 0/8 | 0/8 | 0.0% |
Multi-region sweep
Squares show captured success counts, grouped for readability. They do not claim the original trial order.
API keys & environments
Squares show captured success counts, grouped for readability. They do not claim the original trial order.
Entitlement overage lines
Squares show captured success counts, grouped for readability. They do not claim the original trial order.
Customer identity migration
Squares show captured success counts, grouped for readability. They do not claim the original trial order.
Billing schedule migration
Squares show captured success counts, grouped for readability. They do not claim the original trial order.
API token metering
Squares show captured success counts, grouped for readability. They do not claim the original trial order.
S3 datastore measurement
Squares show captured success counts, grouped for readability. They do not claim the original trial order.
Linearizable scan
Squares show captured success counts, grouped for readability. They do not claim the original trial order.
Tax jurisdiction
Squares show captured success counts, grouped for readability. They do not claim the original trial order.
Analytics stream reducer
Squares show captured success counts, grouped for readability. They do not claim the original trial order.
Selected task: Multi-region sweep.
03
Effort & the frontier
Higher cost does not guarantee a higher resolution rate
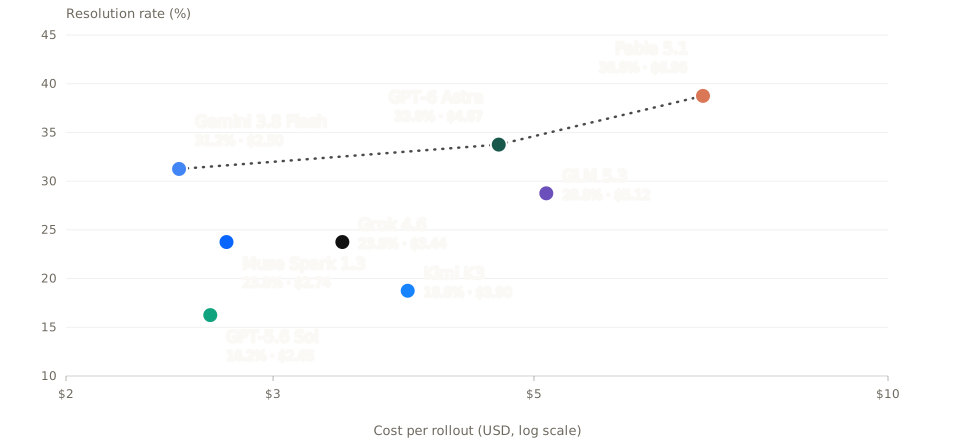
Estimated rollout costs range from $2.50 to $6.96
| Rank | Model | Estimated cost (USD) |
|---|---|---|
| 1 | Gemini 3.8 Flash | $2.50 |
| 2 | GPT-5.6 Sol | $2.65 |
| 3 | Muse Spark 1.3 | $2.74 |
| 4 | Grok 4.6 | $3.44 |
| 5 | Kimi K3 | $3.90 |
| 6 | GPT-6 Astra | $4.67 |
| 7 | GLM 5.3 | $5.12 |
| 8 | Fable 5.1 | $6.96 |
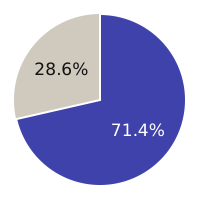
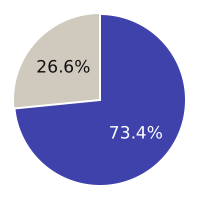
04
Evaluation setup
The public report evaluates ten company-specific tasks. Each model receives a task environment, a written instruction, and the tools available for that workflow. These charts and tables are frozen source evidence, not a live performance feed.
This reconstruction does not distribute private repositories or reproduce the benchmark runner. Metric switching selects between two captured chart views; it does not query a service.